Soil Properties Mapping
|
Soil Properties Mapping
|
|
| Veris determines textures (sand silt and clay), water and nutrient holding capabilities and salty areas. Seeing the soil from different areas in the field helps you recognize the soils capabilities.
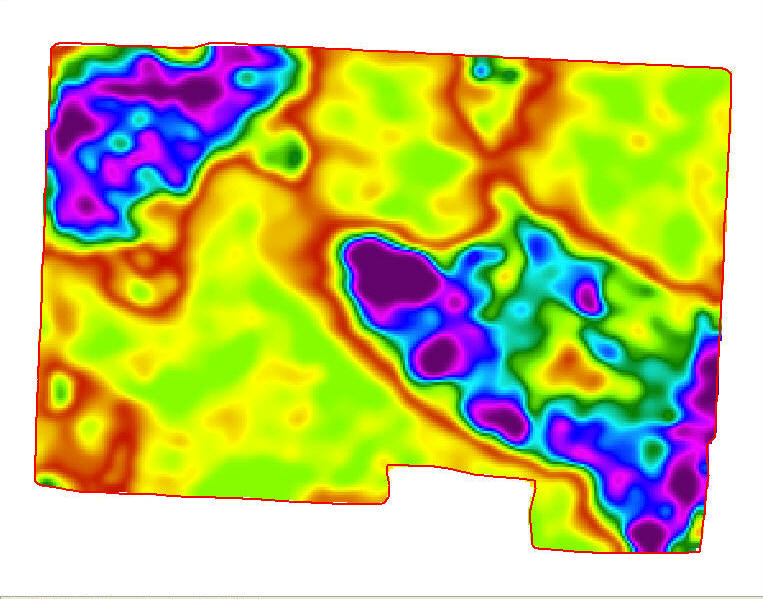
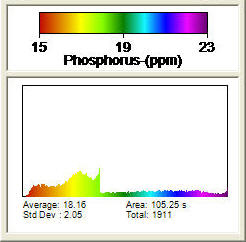
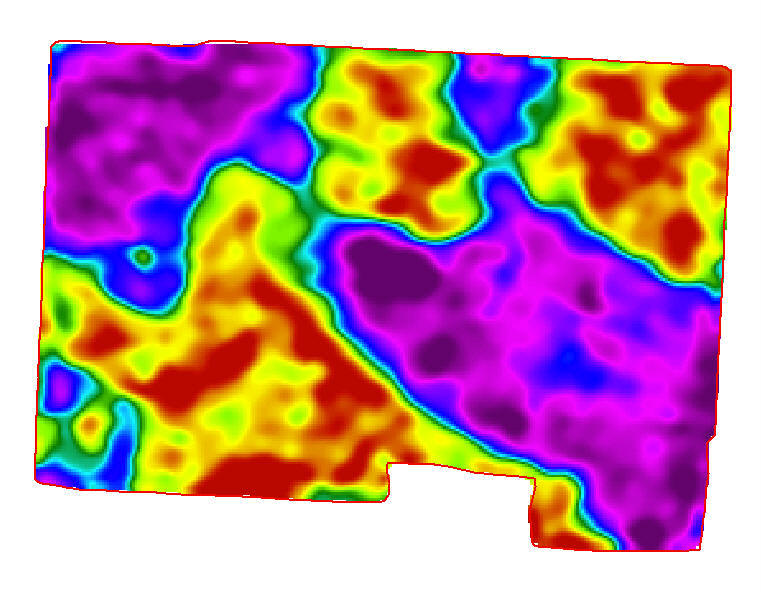
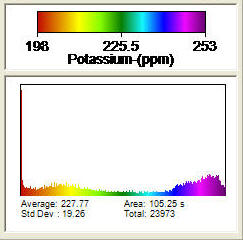
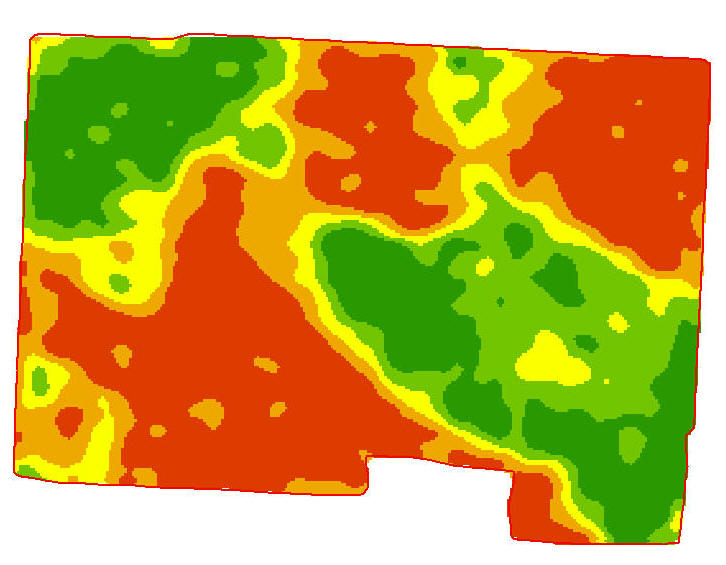
The map below is of the same field with five zones. Nitrogen, Phosphorus, Potassium, Organic Matter and Sulfur. Note that the highest yielding area of this field has the lowest soil test results.
| ||||||||||||||||||||||||||||||||||||||
|
|